
Well I did it, I released a piece of software that was not much more than a fever dream a few years ago. Will it be a huge help to all people? no. Will it be of some help to some people? TBD.
But I guess the first question that needs answering: What is it, and what’s it do?
Well, its called Signal Peak and its named both for it’s function and because it’s a nice sounding name of an actual peak in my home state of Utah. I would guess that there are a few Signal Peak’s around in the world but this one is mine. What it does is provide a radio “viewshed”, a 3 dimensional radio wave propagation estimation, and then project it to a map. i.e. if you put a radio on a certain place on the map, where will its signal be seen and where will it be blocked by terrain. It uses the Longely-Rice ITM model which factors for line-of-sight, diffraction and scatter.
The TLDR is that its a windows based software for amateur radio nerds to be able to map out radio paths for irregular terrain. The math is part of an open library meant for this purpose. My tool creates a UI with mapping tools and, most importantly, a method to capture and collect radio stations for analysis. The use case for me was to map the APRS network in my state and compare it with historical data of my travels to see if my model matched up with reality. If so, I could make an educated guess as to where my future travels would have location reporting coverage and where the dead zones would be.
It’s a marriage of my Overland and HAM interests really. With this data, I know where my family will be able to track me for their peace of mind on the APRS network, where I know I will be able to send SMS messages for check-in through the APRS gateway, and where I will be able to request whether reports from WxBot. All these tools have been immensely useful for me in my travels, but its always been a trial and error in where they work and where they don’t.
While I can’t promise that my propagation assumptions, like link budget and antenna height, are accurate or that my projection modeling is perfect, I can say its a really neat and tidy way to get a broad picture of a large area network that is a big value to the HAM community. Anyone really.
I would like to write up a detailed post on how I did it, but this post is a general announcement and a request to try it out!
What you need - A windows computer. That’s pretty much it.
The source code is written in Python and its available to be compiled in Linux and for MACOS, but I haven’t run a compiler for those.
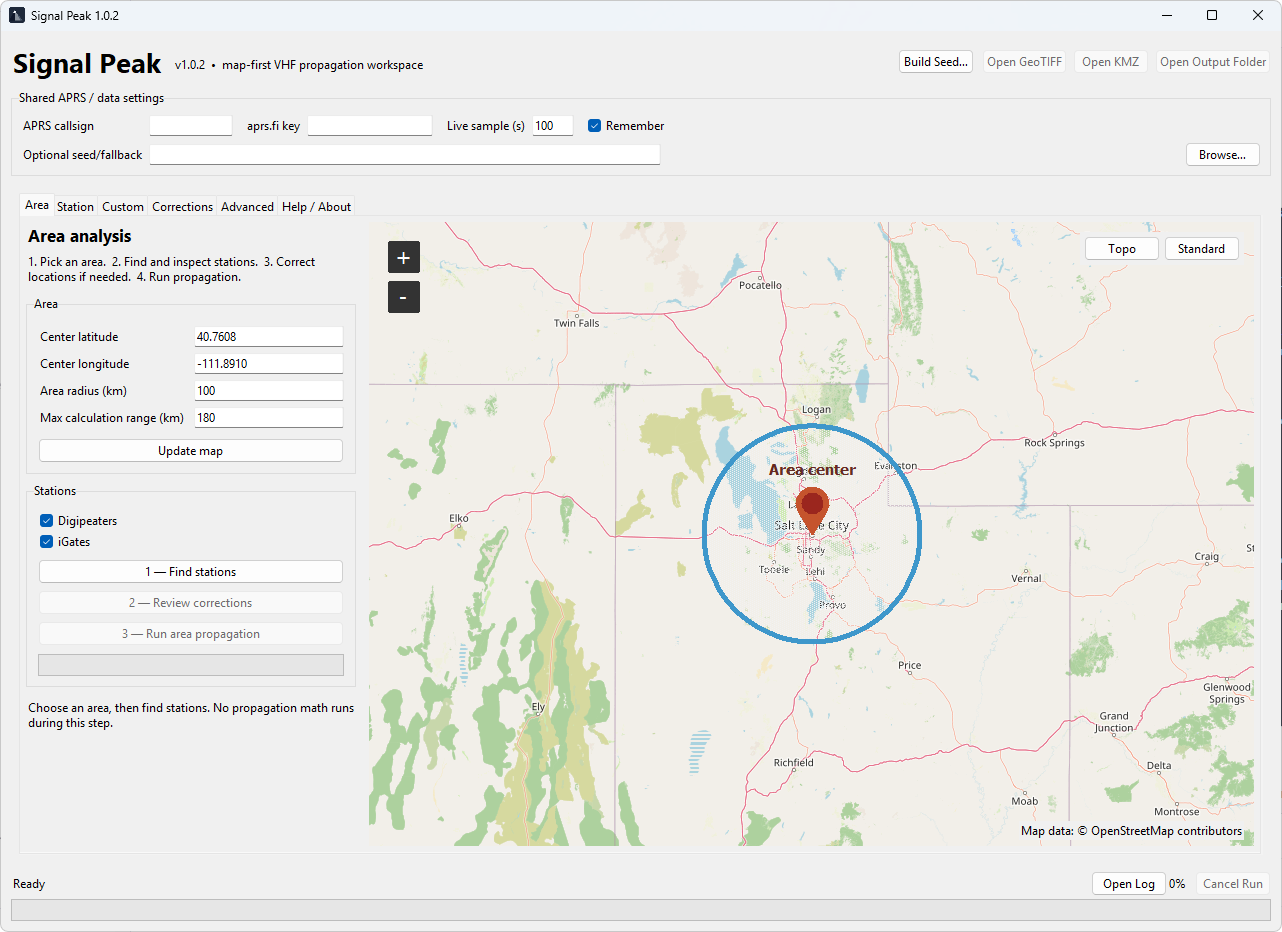
What it does.
It starts by listening on the open source APRS-IS network for certain stations in an area that you designate on the map for a time you select (between 1 and 300 seconds) and then shows you on a map what it found. You can then run the model on all stations it gathered, or individual ones. The output is a google earth KMZ file you can open on the desktop or web app. It also produces a tiff file with the DEM data for the area you searched. This alone is a really big plus for all kinds of 3d modeling and Geospatial uses. If you want REAL, accurate 3d mapping of an area, this is a great tool along for that. Great for making maps for games like BeamNG
.png)
The program has 3 basic functions plus a few bonus ones.
- Area wide report for all APRS digipeaters (repeaters) and i-gates (repeaters that use the internet as the final destination). Useful for the original goal of understanding how the APRS network works for me.
- Individual station report. Once you’ve gotten a read of your area you can choose individual stations to run. The google earth output allows you to turn on and off stations to get the same effect, but the ITM calculations are pretty CPU hungry so it speeds up the process if you have a slow machine or just want information on one station.
- Custom station. Looking to add a repeater or just want to know what you might expect for a personal station’s coverage you can try it out.
Bonus
Because APRS-IS is a live, non-cached network, it doesn’t persist as a database to download - by design - so what I’ve done is create a listening program that hears the live station reports and saves them to a local database. This is for use in the ITM calculations, not for any other use.
The quick version is run when you “search for stations”. But because its not very often that many of these stations report, a long listen is better. If you “build seed” it will listen for much longer to build a much more inclusive list. You can listen in this mode for hours or days.
Finally you can compare this automatic gathered data against the map and make corrections if needed. Sometimes the station location data is not formatted correctly, sometimes there is ambiguity in the location position from the transmitter. Sometimes the station is just not in the right place on the map.
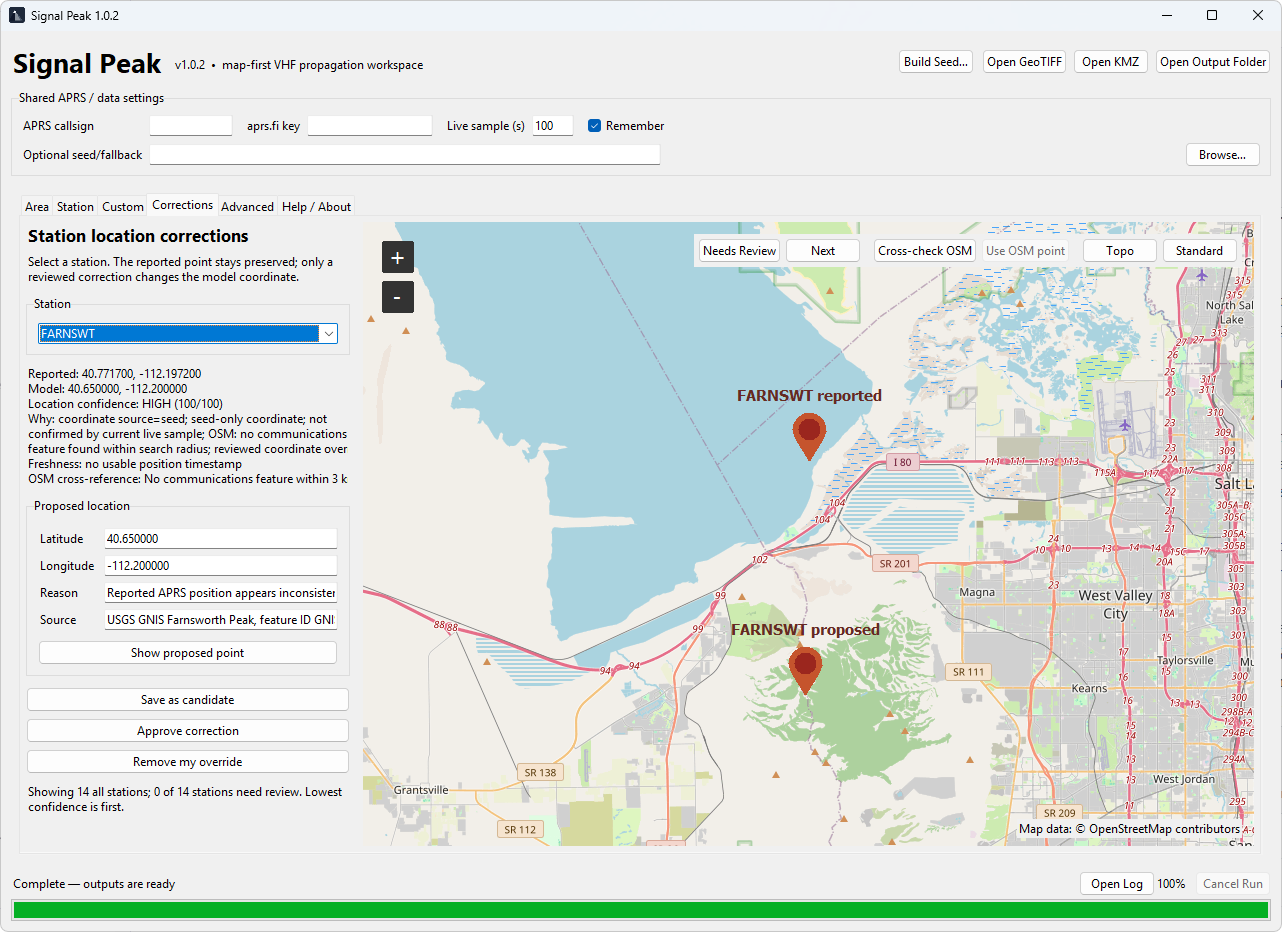
The software looks at the map data and checks to see if the station is near a listed radio antenna on OpenSourceMaps and if it correlates highly it makes a correction, if not it flags it. You can view and correct each station as needed. In the above example, Farnsworth peak is not at the level of the great salt lake, but on…you guessed it…Farnsworth peak. Not correcting this location gives a very different propagation outcome as you might guess.
The map supports topo function so you can check high mountain repeater sites that they are actually on mountain tops as a sanity check.
There is an advanced tab that lets you modify base assumptions like Tx power, antenna height, link budget and other things if you want to mess with them. All the documentation is in its own tab.
Its just Version 1.0.2 right now, so expect some bugs, and odd behavior, but I’ve tried to test it to make sure it work.
NOTE: because this program isn’t digitally signed, there is a warning to not run it on windows. If you click on “more info” you can choose “run it anyway”. You obviously just have to take my word that its not malicious, but the source code is available on my GitHub if you want check it out for yourself first. Everything runs locally or is one way data communication (listening) so there is no data transmitted out (save for OpenSourceMaps API requests)
Also note that its a completely portable app, so it creates a folder on the root director of the .exe. My suggestion is to put it on a folder on your machine called “Signal Peak” before running it so all the data stays there.